Saturday, March 28, 2015

Collectible Cartridges

My original plan for this blog was to start with a monthly post cadence, but, you know, life. New plan: make up for a bit of the lost time over the next few weeks with some quicker posts, try to maintain a monthly schedule going forward, and don't beat self up if it doesn't happen.

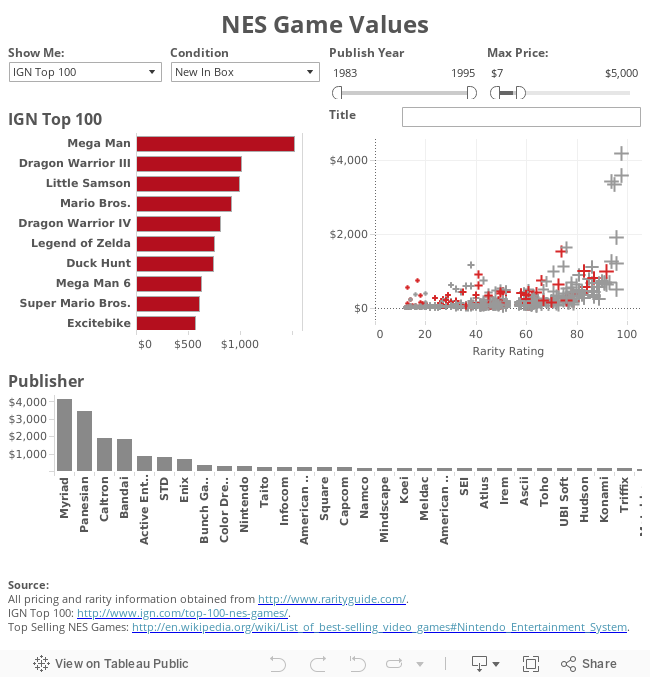
For this viz, I grabbed data (the old-fashioned CTRL+C/V way) from RarityGuide.com (http://www.rarityguide.com/) - they have a TON of information on all sorts of collectibles, but I focused on an 8-bit soft spot of mine: Nintendo Entertainment System games. I built the viz to explore price and rarity data by year released, published, and individual title, but after looking at the data, I wanted to include additional layers to add some further context. I've included parameters to call out IGN's top 100 list (http://www.ign.com/top-100-nes-games/), best-sellers (http://en.wikipedia.org/wiki/List_of_best-selling_video_games#Nintendo_Entertainment_System), and games with an appearance by a particular red-wearing plumber (http://en.wikipedia.org/wiki/List_of_video_games_featuring_Mario).

The results were interesting - take a look and see where your favorites fall or how many of the more elusive collectibles you recognize (I got a laugh out of Googling the games from Panesian - call me naive).

 I only did a basic copy+paste from the Wikipedia lists linked above, but I'm excited to check out the creative ways others have been using Wikipedia to satisfy their data exploration cravings. If you haven't checked it out, Tableau just wrapped up their Wiki Data Viz Contest and the entries can be found here. Unfortunately, voting for the Crowd Favorite has ended, but I still think these workbooks are worth checking out for some inspiration.

 Duck Hunt, anyone?

Monday, November 10, 2014

Origins

Hello there and thank you for stumbling across my very first blog post! 

A little over a month ago, I attended the Tableau Customer Conference and was inspired by a presentation titled 'Porn, Pokemon, and Pop Culture' - all about using Tableau Public and a number of data scraping tools and techniques to satisfy the itch to get creative with data presentation (at least that's what I got out of it). I finally had a chance to sit down and test what I learned, and I'm pretty excited (also a bit nervous, truth be told) to share it with you. Without further ado, here's me partying with my data (as all the TCC shirts say):

I happened across a pretty amazing superhero database, cleverly named Superhero Database and thought it would be a great dataset with which to experiment. As recommended in the previously mentioned preso, I used import.io to collect the data points I wanted, plus some extras just for funsies, from each character page. The web crawler tool is amazing, more on that later. Did a bit of manual clean up, and then made a little map to show us the origins of many of our favorite heroes and villains. A little disclaimer: due to my manual tinkering and some gaps in the data, you may not see your favorite character. Also, I may have taken some liberties with the location of a few fictional or at least debatable cities (e.g., Gotham City, Atlantis) - please don't come after me, it's all just for fun, right?

Also, big thanks to Jewel Loree, Paint by Numbers, and VizWiz for the very informative and inspiring presentation. 

Any comments or questions on what I did here? Let me know - I'd love to hear from you!